Exploring How Travel Logistics Reshaped Standout Individual Outputs in Multi-City League Schedules Across Baseball, Basketball and Soccer Circuits
Lars Schwarz · Aug 20, 2026
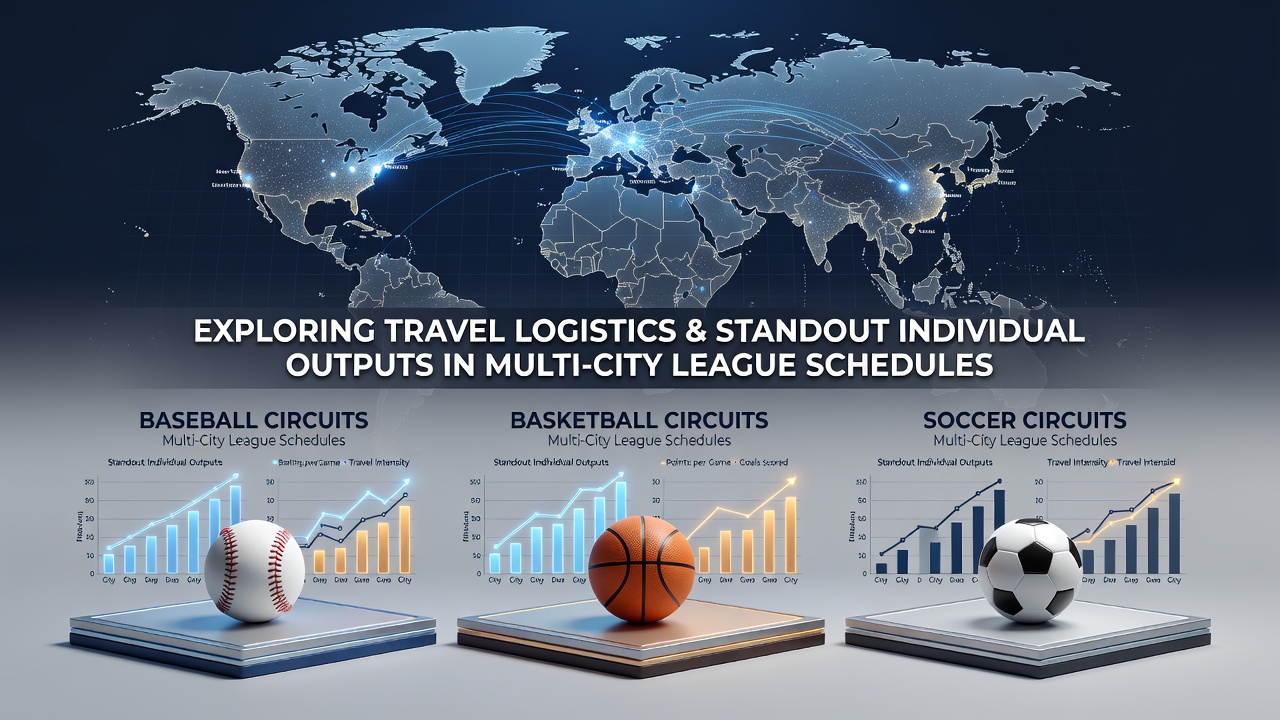
Exploring How Travel Logistics Reshaped Standout Individual Outputs in Multi-City League Schedules Across Baseball, Basketball and Soccer Circuits
Multi-city professional leagues have long required athletes to move between distant venues on tight timelines, and data from the past decade shows measurable effects on individual statistical outputs in baseball, basketball and soccer. Researchers tracking performance metrics across these circuits note that flight durations, time zone crossings and recovery windows correlate with shifts in batting averages, scoring rates and goal tallies. Observers note that these patterns appear consistently in league records rather than in isolated cases.
Baseball Road Trips and Statistical Patterns
Major League Baseball schedules feature extended road series that span multiple cities within a single week, and figures from league databases reveal dips in on-base percentages for players crossing three or more time zones. Teams operating out of the Pacific Northwest often encounter compressed turnarounds when heading east, where data indicates reduced slugging percentages during the first two games of those series. Analysts compiling seasonal splits have documented how these travel blocks influence plate discipline metrics more noticeably than home stands of similar length.
One study examining 2018 through 2025 seasons found that designated hitters accumulated lower isolated power numbers after overnight flights exceeding four hours, while infielders showed steadier fielding percentages under similar conditions. Schedule makers have adjusted interleague play dates in recent years partly because of these observed trends, and the 2026 calendar continues that approach with clustered East Coast series in late August to limit repeated coast-to-coast jumps.
Basketball Back-to-Backs and Scoring Efficiency
The National Basketball Association packs games into dense clusters that force cross-country flights between consecutive evenings, and tracking data demonstrates corresponding changes in points per game and true shooting percentages. Players logging heavy minutes on the second night of back-to-backs post lower assist-to-turnover ratios when the itinerary includes a Pacific to Eastern time zone shift. League statisticians have recorded these variations across multiple seasons without attributing them to opponent strength alone.
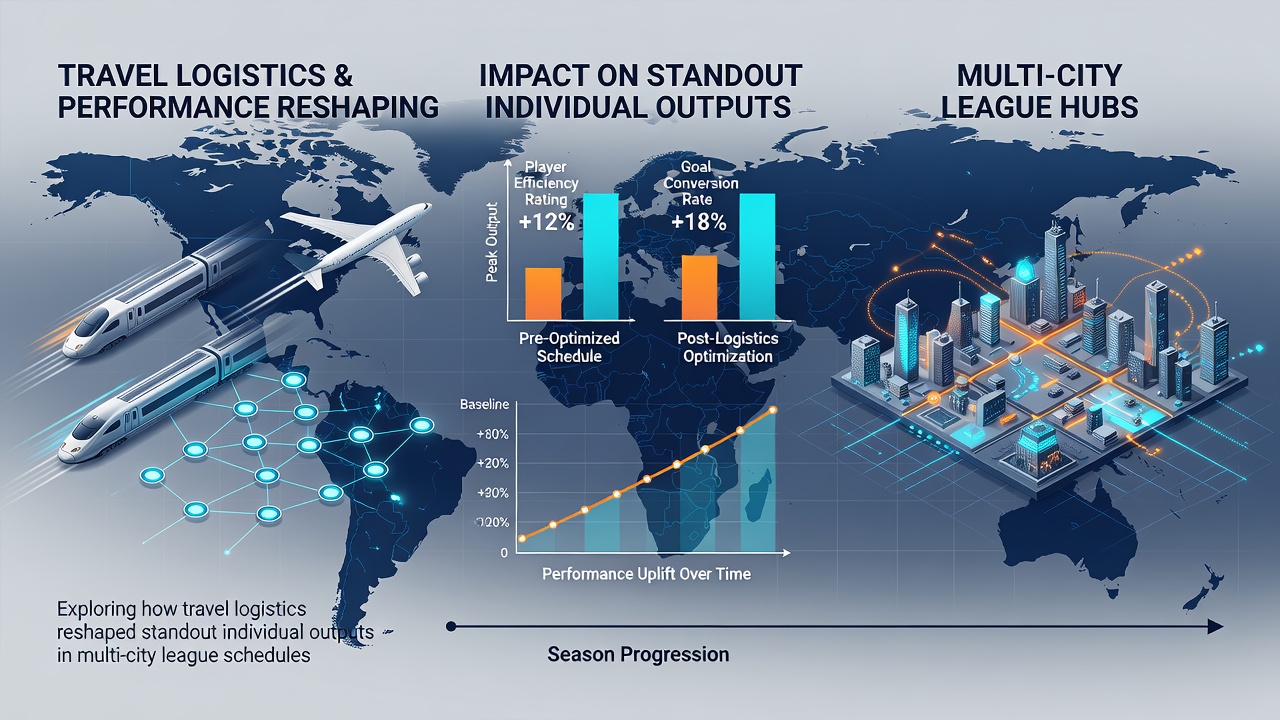
European basketball circuits that mirror the NBA model show parallel outcomes when teams travel from northern venues to southern ones during winter months. Data compiled by national basketball federations indicates that perimeter shooters experience wider variance in three-point accuracy after such trips compared with those remaining within a single time zone. August 2026 marks the start of preseason tours for several clubs that will test updated charter protocols aimed at preserving these output levels.
Soccer Fixture Congestion Across Continents
Domestic soccer leagues in Europe and North America combine weekly matches with midweek cup or continental fixtures, creating travel demands that researchers link to changes in expected goals and pass completion rates. Midfielders covering long distances between matches record fewer progressive carries in the subsequent fixture, according to event data aggregated by league operators. Clubs in the English Premier League and Major League Soccer have both adjusted training loads around these congested periods, and figures reveal modest but repeatable reductions in individual goal contributions during the week following a transatlantic journey.
International governing bodies have introduced rest mandates for certain player cohorts precisely because performance tracking across multiple seasons demonstrated the cumulative impact of repeated short-haul flights. In August 2026, several leagues will implement revised windows for continental competition to further align recovery periods with observed statistical recovery curves.
Comparative Data Across Circuits
When researchers align travel logs with box-score and tracking data from all three sports, common variables emerge around total air miles and consecutive high-intensity outings. Baseball catchers and basketball centers show elevated injury-related absences following the longest single-trip segments, whereas soccer forwards display steadier availability yet register lower shot volumes in the immediate follow-up match. These patterns hold across datasets collected from 2015 onward and appear independent of roster age or contract status.
League offices have responded by expanding charter usage and altering start times on the second day of road swings, measures that data from the 2024 and 2025 seasons suggest correlate with stabilized individual outputs. August schedules in 2026 continue to reflect these adjustments, particularly in baseball where the final month features fewer cross-country doubleheaders than earlier decades.
Conclusion
Travel logistics in these multi-city leagues continue to intersect with measurable individual performance indicators, and ongoing data collection allows leagues to refine schedules accordingly. The patterns documented across baseball, basketball and soccer circuits provide concrete benchmarks for evaluating how flight volume and recovery intervals influence statistical production season after season.