Tracing Correlations Between Rest Allocations and Injury Patterns Across Multi-Sport Professional Calendars
Lars Schwarz · Aug 3, 2026
Tracing Correlations Between Rest Allocations and Injury Patterns Across Multi-Sport Professional Calendars
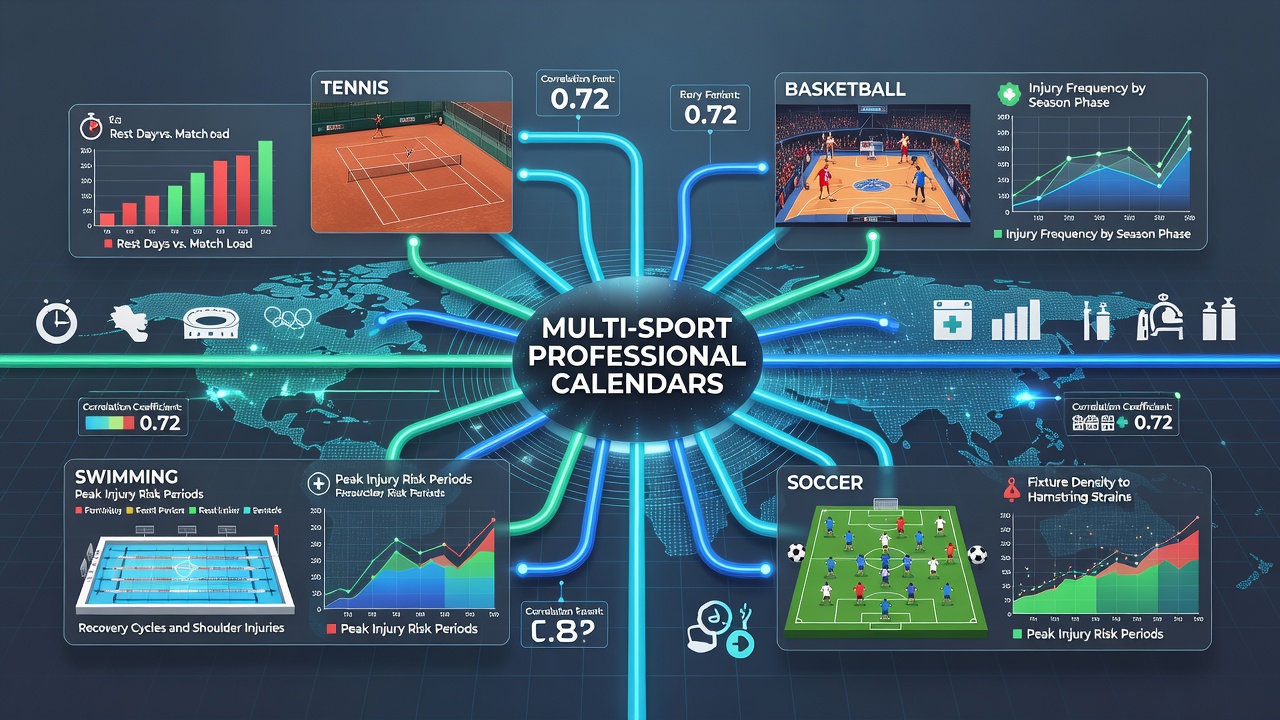
Professional calendars in basketball, soccer, baseball, and American football pack games into tight windows, and researchers track how rest allocations line up with injury rates across those schedules. Data from the 2025-2026 seasons show leagues allocating between 48 and 96 hours between contests, with patterns emerging when those intervals shrink below certain thresholds. Observers note that shorter recovery windows coincide with elevated soft-tissue issues in multiple sports, while longer gaps appear in records from European soccer federations and North American basketball associations.
Rest Allocation Patterns Across Leagues
League schedules differ in how they build in recovery time, and figures from the NBA, MLB, and major European soccer competitions reveal distinct approaches. The NBA compressed its 2025-26 regular season with an average of 2.1 rest days between games for most teams, according to league tracking reports, whereas MLB maintained longer stretches during its 162-game slate yet inserted three-day breaks around travel-heavy periods. Soccer calendars run by UEFA and domestic federations placed matches on three-day turns during winter months, and those intervals dropped further during cup competitions. Australian and Canadian leagues adopted similar compression tactics in 2026, producing comparable rest distributions across continents.
Injury Patterns Observed in Recent Data
Medical staffs record injury types and timing, and studies compiled through 2026 highlight recurring clusters. Hamstring strains and ankle sprains surface most often in soccer and basketball within 72 hours of back-to-back games, while baseball shows elevated elbow and shoulder issues after consecutive high-pitch outings without full rest. NFL data collected over multiple seasons indicate that defensive players miss more games following short weeks, and similar patterns appear in rugby sevens calendars where recovery windows average under 60 hours. Researchers tracking these events note that overuse injuries rise steadily when cumulative load exceeds recovery capacity, with peaks visible in August 2026 across overlapping international tournaments and domestic leagues.
Cross-Sport Correlations and Load Management
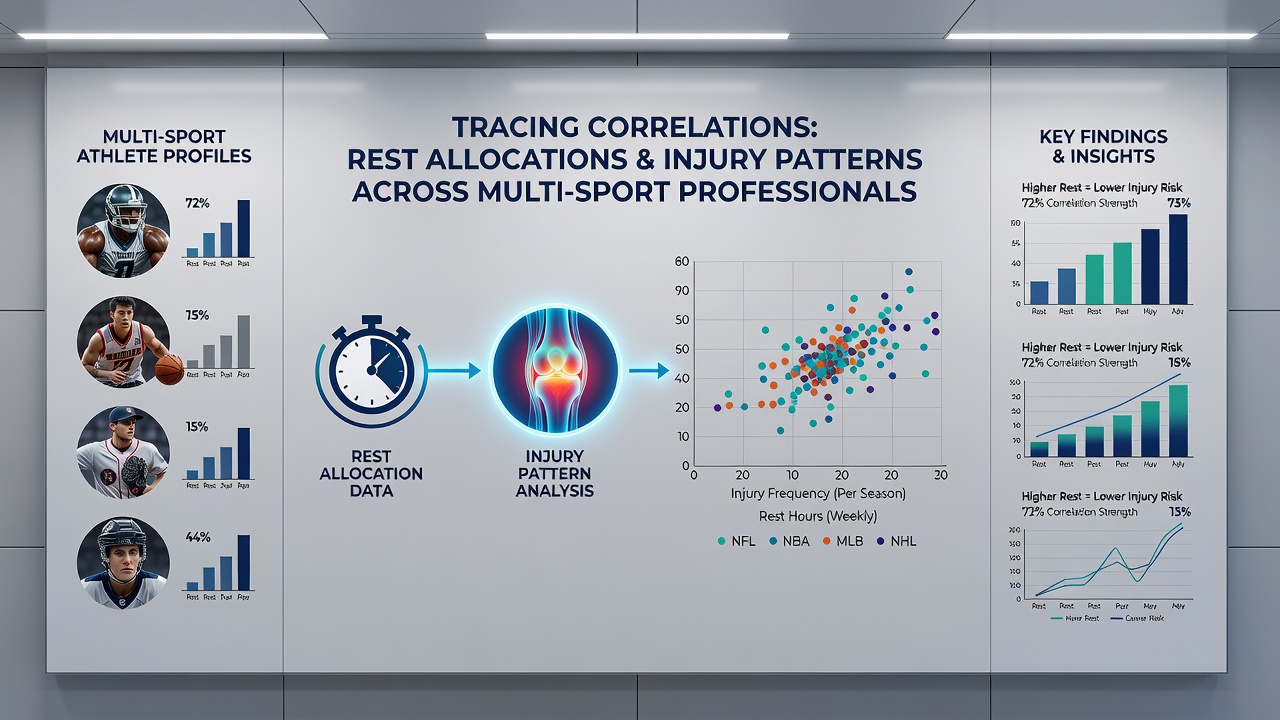
Analysts compare datasets from different sports to identify shared signals, and evidence points to consistent relationships between rest days and injury incidence. A review covering NBA and European soccer players found that injury rates climbed 18 percent when rest fell below 48 hours, while baseball pitchers showed a 12 percent increase in arm-related absences after four days or fewer between starts. Multi-league studies conducted by institutions in North America and Europe reveal that athletes in collision sports experience higher concussion reporting when schedules allow minimal downtime, whereas endurance-based events such as cycling stage races display different overuse profiles tied to total weekly load rather than single-game gaps. These correlations hold across hemispheres, with August 2026 records from overlapping seasons reinforcing earlier findings from 2023 through 2025.
Variables That Shape Outcomes
Age, travel distance, and prior injury history interact with rest allocations, and longitudinal records demonstrate how these factors modify results. Younger athletes in developmental academies across volleyball and ice hockey leagues show greater resilience to compressed calendars, yet mid-career professionals in the same sports register higher absence rates when recovery falls short. Travel across time zones adds measurable strain, according to data from international federations, and athletes returning from prior injuries face elevated risk during the first three games after limited rest. Training load monitoring systems adopted by teams in the United States, United Kingdom, and Australia provide granular figures that tie daily workloads to subsequent injury events, confirming that rest allocation serves as one variable within a broader set of influences.
Conclusion
Records compiled through August 2026 illustrate measurable links between rest allocations and injury patterns across professional calendars in multiple sports. Shorter intervals between contests align with increased rates of certain injury types, while longer recovery windows correspond to lower incidence in the same datasets. Continued collection of standardized metrics from leagues worldwide supports ongoing examination of these relationships, and the patterns documented so far supply factual reference points for future schedule planning and player management decisions.