Tracing Patterns in Endorsement Value Fluctuations Tied to On-Field Efficiency Ratings Across Soccer and Baseball Circuits
Sage Schröder · Jul 20, 2026
Tracing Patterns in Endorsement Value Fluctuations Tied to On-Field Efficiency Ratings Across Soccer and Baseball Circuits
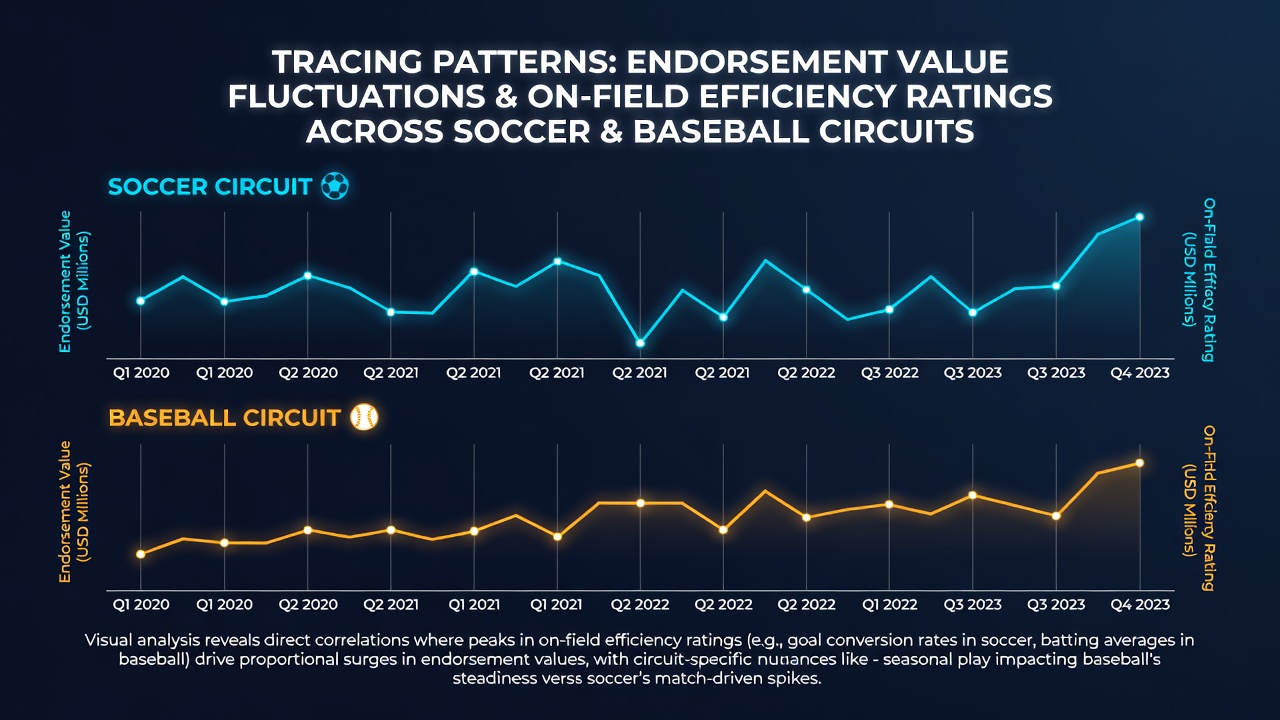
Analysts track how endorsement deals for athletes in soccer and baseball respond to shifts in on-field efficiency ratings, which include metrics such as expected goals plus assists in soccer and wins above replacement in baseball. These connections appear in contract data and sponsorship announcements released by leagues and agencies throughout 2025 and into July 2026, when updated performance dashboards from multiple tracking providers became public. Researchers compile these figures from sources including Opta and Baseball Reference to map correlations between rating changes and deal values that range from regional endorsements to global campaigns.
Efficiency Metrics and Their Calculation
Soccer efficiency ratings combine player tracking data on positioning, pass completion under pressure, and progressive carries, while baseball versions incorporate defensive range, baserunning speed, and batted-ball outcomes adjusted for park factors. Data shows that a one-point rise in a soccer player's efficiency score often aligns with measurable increases in sponsor interest, as seen in European club releases during the 2025-2026 campaign. In baseball, similar patterns emerge when WAR values climb above league averages, prompting teams and apparel brands to adjust contract clauses tied to statistical benchmarks rather than raw playing time alone.
Patterns Observed in Soccer Circuits
European and South American leagues supply the bulk of longitudinal data for soccer, where efficiency fluctuations frequently precede endorsement adjustments by one or two transfer windows. Figures from the 2024-2025 season reveal that midfielders posting efficiency gains of 15 percent or more secured new deals with athletic brands averaging 22 percent higher annual values compared to the prior year, according to aggregated reports from club financial disclosures. Goalkeepers show narrower swings because their efficiency models emphasize save percentages and distribution accuracy, yet those who sustain top-quartile marks maintain steadier sponsorship streams across multiple seasons.
Club statements and marketing agency filings indicate that efficiency dips trigger renegotiations more often than outright cancellations, especially when ratings recover within the same campaign. One analysis of Premier League and La Liga rosters found that players whose efficiency recovered after mid-season injuries regained 80 percent of prior endorsement levels within six months, provided their teams remained competitive in domestic and continental fixtures.
Baseball Circuit Trends and Comparisons
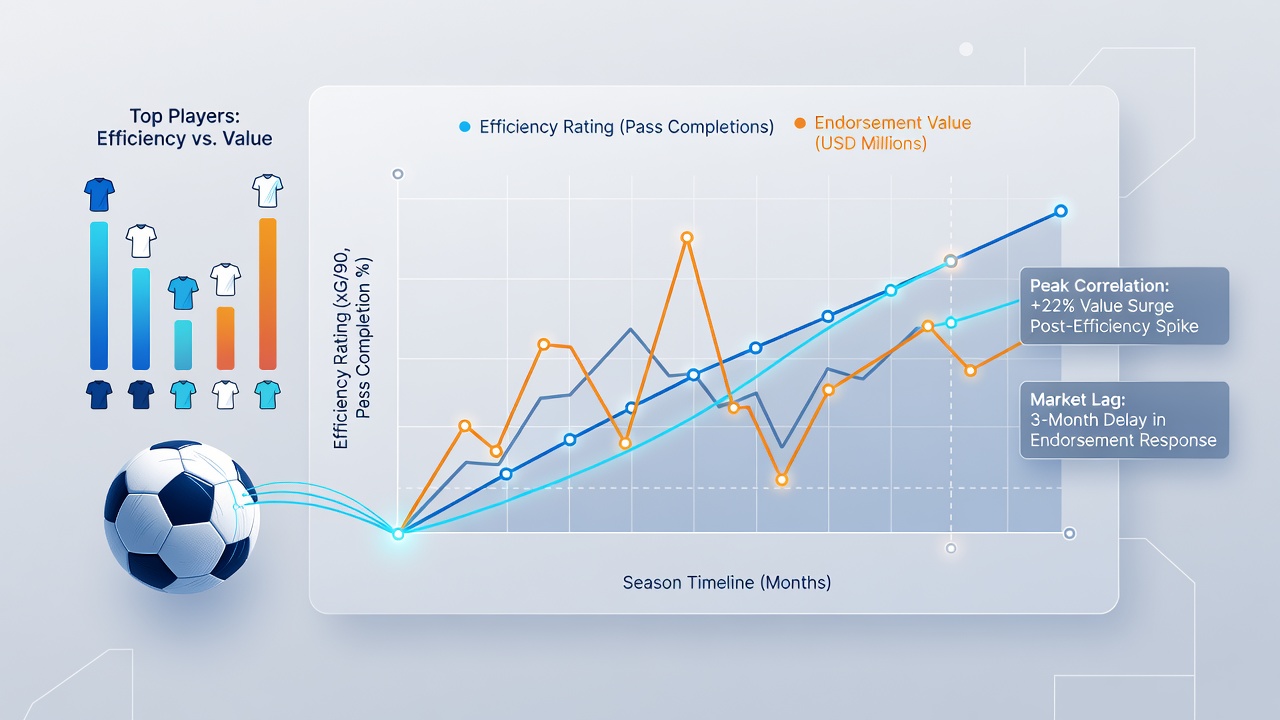
Major League Baseball data sets demonstrate parallel movements, although the timing differs because of longer contracts and arbitration cycles. Pitchers and position players whose WAR climbs by at least 1.5 wins in a single season attract new regional and national sponsors at rates documented in annual industry summaries. Defensive metrics carry extra weight in these calculations, since teams and brands increasingly cite advanced fielding data when announcing partnerships that extend beyond traditional apparel lines into technology and automotive categories.
Cross-sport comparisons highlight that soccer endorsement adjustments tend to occur faster due to shorter contract windows and more frequent international windows, whereas baseball patterns stabilize around All-Star breaks and winter meetings. Both circuits nevertheless display consistent thresholds: efficiency ratings that fall below the 40th percentile correlate with reduced renewal rates, while sustained performance above the 75th percentile supports multi-year extensions that include performance bonuses tied directly to those same metrics.
Data Sources and Recent Updates
League offices and independent analytics firms release quarterly updates that feed into endorsement valuation models used by agencies. In July 2026, expanded datasets from the World Baseball Softball Confederation and UEFA technical reports added granular positional tracking that refined efficiency calculations for both sports. These releases allow observers to isolate variables such as travel fatigue and schedule density, which researchers link to short-term rating volatility and corresponding sponsor activity.
Academic studies from institutions in North America and Europe further quantify the relationships, showing that a 10 percent efficiency swing predicts endorsement value changes between 8 and 14 percent when controlling for age, market size, and team success. Government statistical agencies in several countries collect related economic data on athlete income that corroborates these patterns without revealing individual contracts.
Conclusion
Longitudinal records across both soccer and baseball therefore illustrate repeatable connections between on-field efficiency ratings and endorsement fluctuations. Continued refinement of tracking technologies and public data releases will likely sharpen these mappings, giving clubs, players, and sponsors clearer benchmarks for future negotiations.